简单随机采样
代码示例
path = r"C:\data\采样表示例.csv"
xlimts = {"x1": [0, 10], "x2": [0, 20]}
s = RandomSampling(xlimts)
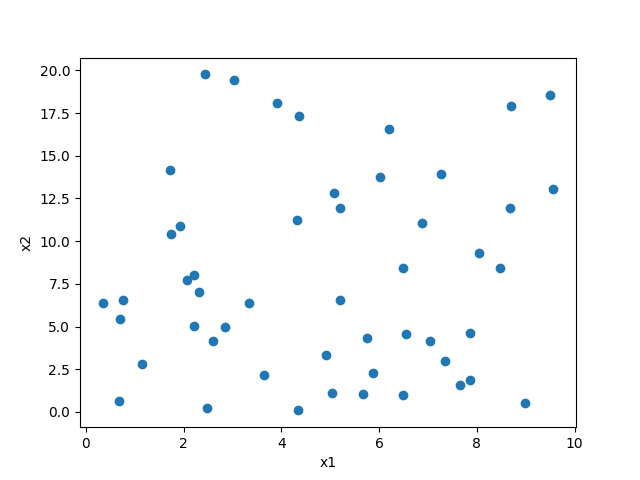
points = s.sample(50, tablePath=path)
# 画图展示
plt.plot(points[:, 0], points[:, 1], "o")
plt.xlabel(s.xTitle[0])
plt.ylabel(s.xTitle[1])
plt.show()